by Richard Cull
March Market Recap and Commentary
Commentary
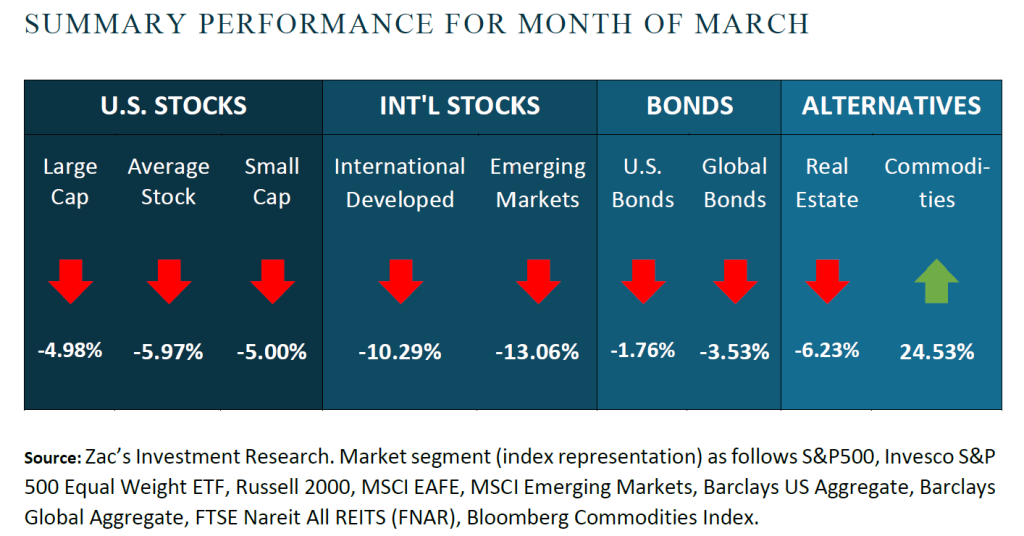
Financial markets in March were driven by the Middle East conflict that began mid-morning on February 28th. Nearly all major asset classes, with the exception of certain commodities, posted meaningfully negative returns for the month. The losses were not immediate but developed over the course of the month as investors increasingly weighed the potential economic and geopolitical consequences of a longer-term conflict.
The market’s initial reaction to the conflict was relatively measured. Oil and natural gas prices moved higher, gold and defense stocks rose, and airline stocks declined, reflecting the typical response to geopolitical conflict. However, despite disruptions to shipping routes through the Strait of Hormuz, WTI crude traded in the low-to-mid $70s per barrel in early March, roughly in line with levels seen during last year’s brief Iran-Israel conflict, suggesting investors expected a contained conflict rather than a prolonged disruption.
Markets declined further during the first week of March as newly released economic data pointed to signs of softness in the U.S. economy. The Federal Reserve’s Beige Book, released on March 4th, described economic activity as moderate but uneven, noting that higher-income households continued to drive much of the spending, while lower- and middle-income consumers increasingly traded down to lower-cost products. Two days later, the February payroll report showed a surprise loss of 92,000 jobs and an increase in the unemployment rate to 4.4%. Taken together, the data suggests the pace of economic growth may be slowing somewhat and becoming more uneven across income groups and regions.
This creates a complicated backdrop for the Federal Reserve, whose dual mandate is to promote full employment and stable prices. Signs of softness in the labor market would typically support lower interest rates, but rising energy prices could put upward pressure on inflation, potentially limiting the Fed’s ability to ease policy in the near term. As a result, monetary policy may remain restrictive for longer than markets had previously expected.
As the month progressed and the conflict spread beyond initial expectations, markets began to price in the risk of more sustained disruptions to global energy supply and trade routes. Beyond the immediate impact on oil prices, the conflict also began to disrupt supply chains across several industries, raising concerns that inflation could remain elevated. This combination of higher energy costs, supply chain disruptions, and slowing growth contributed to increasing weakness across financial markets during the remainder of March.
The final day of March brought some much-needed relief to financial markets. Reports from local Iranian media indicating a willingness to enter negotiations helped ease fears of a prolonged conflict, and equity markets responded with a sharp relief rally to close the month.
While the situation remains fluid and difficult to predict, the events of March serve as a reminder that markets can move quickly in response to geopolitical developments and changing economic expectations. In environments like this, diversification remains important, as does the experience and discipline to stay focused on long-term investment objectives rather than short-term market movements.
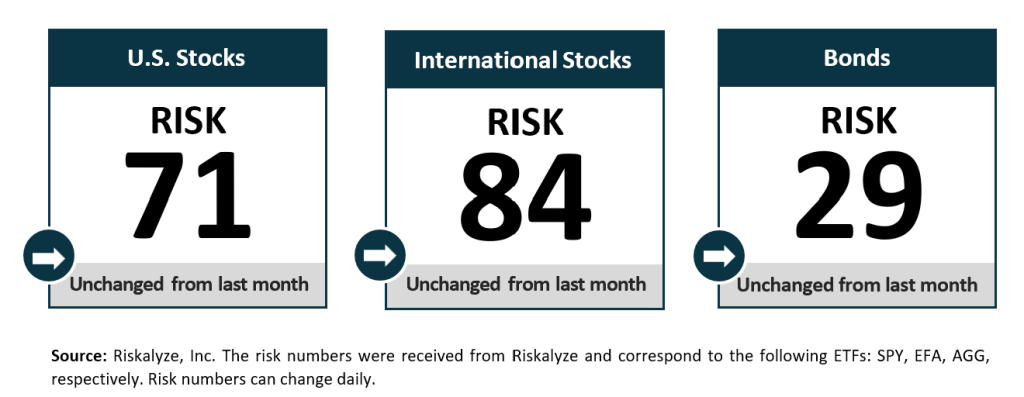
Risk Numbers
As of 04/06/2026
The Risk Number is at the heart of a sophisticated set of tools to precisely measure the appetite and capacity for risk that each client has and demonstrate their alignment with the portfolios built for them. The following graphic shows the risk of various asset classes as measured on a scale of 1-99 (1 being the most conservative and 99 being the most aggressive) as of the date above.
Centric's Approach
We start with a Risk Number, a measurable way to pinpoint how much risk you want, need, and already have. Then, your wealth advisor will optimally allocate our investments to help you reach your financial goals. Along the way, you will receive transparency of information, seamless proactive service and the trust and accountability you need to stay on track. All of this will lead to your personal comprehensive investment strategy that is powerful, disciplined, responsive.
Sources:
Centric’s Market Assumption Disclosures: This information is not intended as a recommendation to invest in any particular asset class or strategy or product or as a promise of future performance. Note that these asset class assumptions are passive, and do not consider the impact of active management. All estimates in this document are in US dollar terms unless noted otherwise. Given the complex risk-reward trade-offs involved, we advise clients to rely on their own judgment as well as quantitative optimization approaches in setting strategic allocations to all the asset classes and strategies. References to future returns are not promises or even estimates of actual returns a client portfolio may achieve. Assumptions, opinions and estimates are provided for illustrative purposes only. They should not be relied upon as recommendations to buy or sell securities. Forecasts of financial market trends that are based on current market conditions constitute our judgment and are subject to change without notice. We believe the information provided here is reliable, but do not warrant its accuracy or completeness. If the reader chooses to rely on the information, it is at its own risk. This material has been prepared for information purposes only and is not intended to provide, and should not be relied on for, accounting, legal, or tax advice. The outputs of the assumptions are provided for illustration purposes only and are subject to significant limitations. “Expected” return estimates are subject to uncertainty and error. Expected returns for each asset class can be conditional on economic scenarios; in the event a particular scenario comes to pass, actual returns could be significantly higher or lower than forecasted. Because of the inherent limitations of all models, potential investors should not rely exclusively on the model when making an investment decision. The model cannot account for the impact that economic, market, and other factors may have on the implementation and ongoing management of an actual investment portfolio. Unlike actual portfolio outcomes, the model outcomes do not reflect actual trading, liquidity constraints, fees, expenses, taxes and other factors that could impact future returns. Asset allocation/diversification does not guarantee investment returns and does not eliminate the risk of loss.
Index Disclosures: Index returns are for illustrative purposes only and do not represent any actual fund performance. Index performance returns do not reflect any management fees, transaction costs or expenses. Indices are unmanaged and one cannot invest directly in an index.
Riskalyze Disclosure: The Risk Number® is a proprietary scaled index developed by Riskalyze to reflect risk for both advisors and their clients. The Risk Number is at the heart of a sophisticated set of tools to precisely measure the appetite and capacity for risk that each client has, and demonstrate their alignment with the portfolios built for them.
Shaped like a speed limit sign, the Risk Number gives advisors and investors a common language to use when setting expectations, recognizing risk and making portfolio selections. Just like driving faster increases hazards, a higher Risk Number equates with higher levels of risk.
General disclosure: This material is intended for information purposes only, and does not constitute investment advice, a recommendation or an offer or solicitation to purchase or sell any securities to any person in any jurisdiction in which an offer, solicitation, purchase or sale would be unlawful under the securities laws of such jurisdiction. Reliance upon information in this material is at the sole discretion of the reader. Investing involves risks.
Get in Touch
Ready to take control of your finances and enjoy more of what matters in your life?