by Richard Cull
May Market Recap

Commentary
The month of May saw a strong advance in the equity markets, a slight decline in fixed-income, and continued selling of the U.S. dollar.
Alright, let’s briefly review the reasons behind these moves.
Calling the month “strong” was a bit of an understatement as equity markets just had their best May since 1990. Corporate earnings came in stronger than expected, unemployment remained low, but most of all President Trump delayed some tariff implementation dates and/or reduced proposed tariff levels. Announcements, comments, and tweets about tariffs will continue to be erratic and will continue to cause volatility…to the upside and downside.
Fixed income, which receives very limited media coverage, is being watched very closely after a few large intra-day moves in the last two months. The first was April 20th when President Trump talked about firing Federal Reserve Chairman Powell, then saying he would not do so as long-term bonds sold off on his comments. Then in mid-May, Moody’s downgrade U.S. debt from Aaa (the highest rating) to Aa1 (one notch below). Citing the governments continued deficit spending, the move seemed symbolic as Fitch downgraded U.S. debt in 2023 and S&P Global did so in 2011. Bond holders did not like the move, but prices settled near unchanged despite elevated intraday price moves. Five days later bonds sold off meaningfully after an auction revealed weaker than expected demand for 20-year Treasuries. In other words, buyers were demanding higher yields (lower prices) to lend the government money…which happens when investors anticipate more risk. This bears monitoring as President Trump’s budget proposal is expected to increase budget deficits through 2034, meaning even more U.S. debt (treasuries) will have to be placed.
And finally, the U.S. dollar is off to its worst start to a year ever. The U.S. dollar index, which tracks the greenback against a basket of six global currencies, is down 8.4% over the first five months. Behind the decline is the rapid tariff rollout which has slowed U.S. imports to a trickle, weighed on global prospects and rekindled inflation concerns. As Barron’s (a financial publication) so frankly surmises, “Sell America is the hot summer trend. A weak dollar is the most visible sign of an aversion toward U.S. assets…”
While tariffs weren’t a concern back in 2023, markets then faced similar anxieties around excessive debt, deficit spending, and elevated inflation. Coming off a challenging 2022, investors ultimately set those worries aside and refocused on strong economic fundamentals. A similar path remains possible in 2025, with improving conditions potentially shifting sentiment and providing renewed support for markets.
Looking ahead, while uncertainty remains around trade policy, fiscal discipline, and currency stability, markets have shown resilience before—and may do so again. As always, volatility creates both risk and opportunity. Staying focused on fundamentals and maintaining a disciplined, diversified approach will be key to navigating whatever the rest of 2025 brings
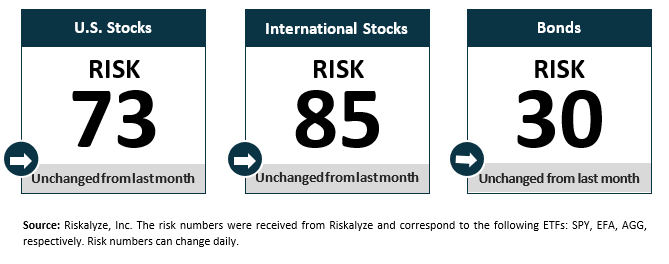
Risk Numbers
As of 06/09/2025
The Risk Number is at the heart of a sophisticated set of tools to precisely measure the appetite and capacity for risk that each client has and demonstrate their alignment with the portfolios built for them. The following graphic shows the risk of various asset classes as measured on a scale of 1-99 (1 being the most conservative and 99 being the most aggressive) as of the date above.
Centric's Approach
We start with a Risk Number, a measurable way to pinpoint how much risk you want, need, and already have. Then, your wealth advisor will optimally allocate our investments to help you reach your financial goals. Along the way, you will receive transparency of information, seamless proactive service and the trust and accountability you need to stay on track. All of this will lead to your personal comprehensive investment strategy that is powerful, disciplined, responsive.
Sources:
Centric’s Market Assumption Disclosures: This information is not intended as a recommendation to invest in any particular asset class or strategy or product or as a promise of future performance. Note that these asset class assumptions are passive, and do not consider the impact of active management. All estimates in this document are in US dollar terms unless noted otherwise. Given the complex risk-reward trade-offs involved, we advise clients to rely on their own judgment as well as quantitative optimization approaches in setting strategic allocations to all the asset classes and strategies. References to future returns are not promises or even estimates of actual returns a client portfolio may achieve. Assumptions, opinions and estimates are provided for illustrative purposes only. They should not be relied upon as recommendations to buy or sell securities. Forecasts of financial market trends that are based on current market conditions constitute our judgment and are subject to change without notice. We believe the information provided here is reliable, but do not warrant its accuracy or completeness. If the reader chooses to rely on the information, it is at its own risk. This material has been prepared for information purposes only and is not intended to provide, and should not be relied on for, accounting, legal, or tax advice. The outputs of the assumptions are provided for illustration purposes only and are subject to significant limitations. “Expected” return estimates are subject to uncertainty and error. Expected returns for each asset class can be conditional on economic scenarios; in the event a particular scenario comes to pass, actual returns could be significantly higher or lower than forecasted. Because of the inherent limitations of all models, potential investors should not rely exclusively on the model when making an investment decision. The model cannot account for the impact that economic, market, and other factors may have on the implementation and ongoing management of an actual investment portfolio. Unlike actual portfolio outcomes, the model outcomes do not reflect actual trading, liquidity constraints, fees, expenses, taxes and other factors that could impact future returns. Asset allocation/diversification does not guarantee investment returns and does not eliminate the risk of loss.
Index Disclosures: Index returns are for illustrative purposes only and do not represent any actual fund performance. Index performance returns do not reflect any management fees, transaction costs or expenses. Indices are unmanaged and one cannot invest directly in an index.
Riskalyze Disclosure: The Risk Number® is a proprietary scaled index developed by Riskalyze to reflect risk for both advisors and their clients. The Risk Number is at the heart of a sophisticated set of tools to precisely measure the appetite and capacity for risk that each client has, and demonstrate their alignment with the portfolios built for them.
Shaped like a speed limit sign, the Risk Number gives advisors and investors a common language to use when setting expectations, recognizing risk and making portfolio selections. Just like driving faster increases hazards, a higher Risk Number equates with higher levels of risk.
General disclosure: This material is intended for information purposes only, and does not constitute investment advice, a recommendation or an offer or solicitation to purchase or sell any securities to any person in any jurisdiction in which an offer, solicitation, purchase or sale would be unlawful under the securities laws of such jurisdiction. Reliance upon information in this material is at the sole discretion of the reader. Investing involves risks.
Get in Touch
Ready to take control of your finances and enjoy more of what matters in your life?