Our Investment Process
Powerful, Disciplined, Responsive
Providing successful investment outcomes and experiences with peace of mind knowing that a transparent approach backed by decades of research is powering every decision.


Foundation Strategies
Asset allocation aligned to your Risk Number
The goal of allocating investments is to minimize risk while meeting the level of return you expect. Centric’s Foundation series, which consists of Voyager and Titan, are well built, dynamic portfolios that match your unique risk number. Foundations seek total return while diversifying risk exposures of various asset classes over the long-term.
Voyager Series
Titan Series
Voyager 25

Potential Annual Return1
95% Probability Range (6 Months)2
Voyager 35
Potential Annual Return1
95% Probability Range (6 Months)2
Voyager 45
Potential Annual Return1
95% Probability Range (6 Months)2
Voyager 55
Potential Annual Return1
95% Probability Range (6 Months)2
Voyager 65
Potential Annual Return1
95% Probability Range (6 Months)2
Voyager 75
Potential Annual Return1
95% Probability Range (6 Months)2
Voyager 85
Potential Annual Return1
95% Probability Range (6 Months)2
Titan 25

Potential Annual Return1
95% Probability Range (6 Months)2
Titan 35
Potential Annual Return1
95% Probability Range (6 Months)2
Titan 45
Potential Annual Return1
95% Probability Range (6 Months)2
Titan 55
Potential Annual Return1
95% Probability Range (6 Months)2
Titan 65
Potential Annual Return1
95% Probability Range (6 Months)2
Titan 75
Potential Annual Return1
95% Probability Range (6 Months)2
Titan 85
Potential Annual Return1
95% Probability Range (6 Months)2
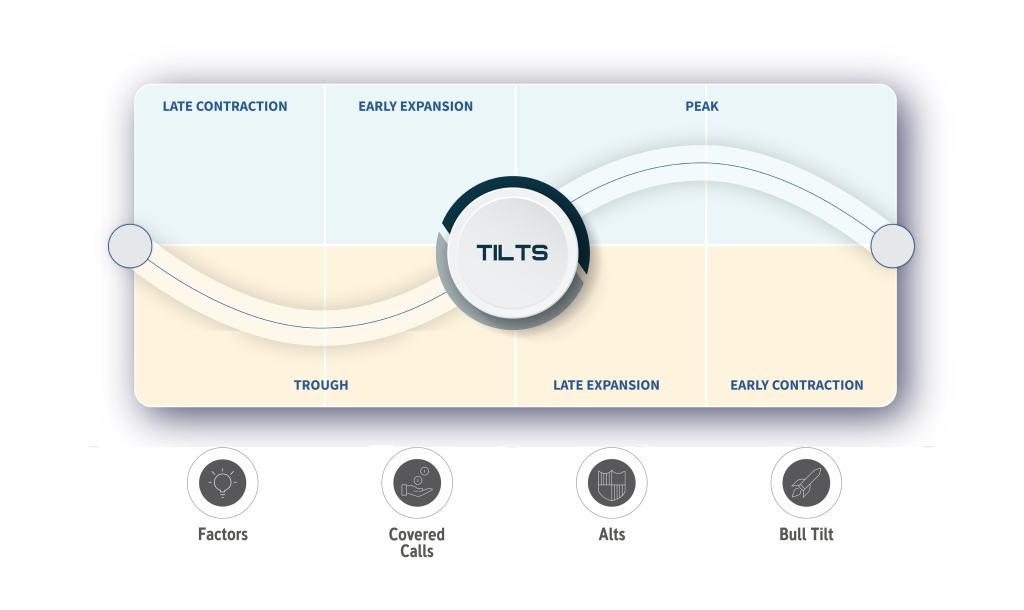
AlphaTilt® Strategies
A proprietary, actively managed portfolio series based on long-term fundamentals and proper diversification. Strategically, at it’s core, AlphaTilt® is a concentrated portfolio of high-quality stocks. Tactically, AlphaTilt® employs tilts around that core corresponding to the prevailing business cycle. Through this duel strategy, AlphaTilt® aims to enhance risk-adjusted returns across all market phases.
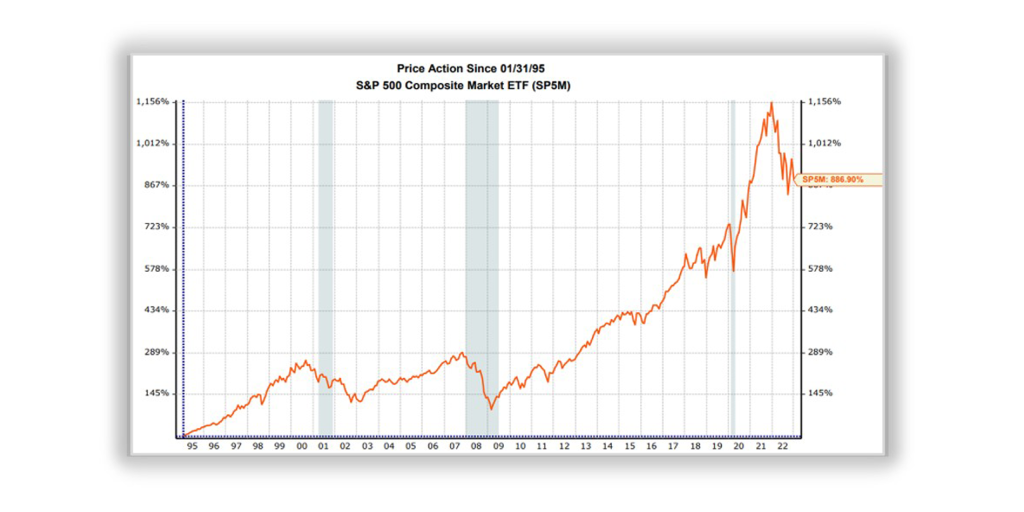
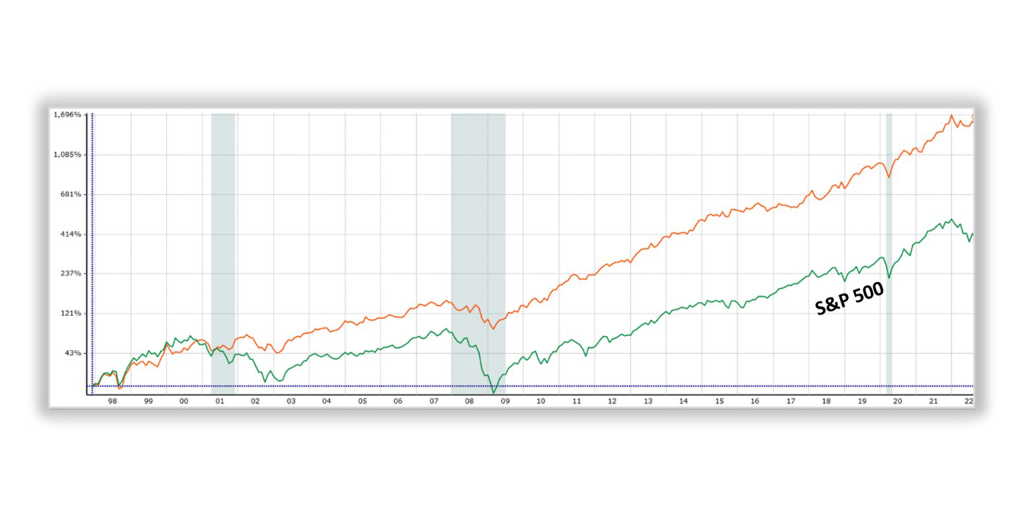
Moving Higher
Markets are volatile in the short term but consistently move higher over time.
Realistic Goals
Investors return objectives and risk constraints help investors set realistic long-term goals
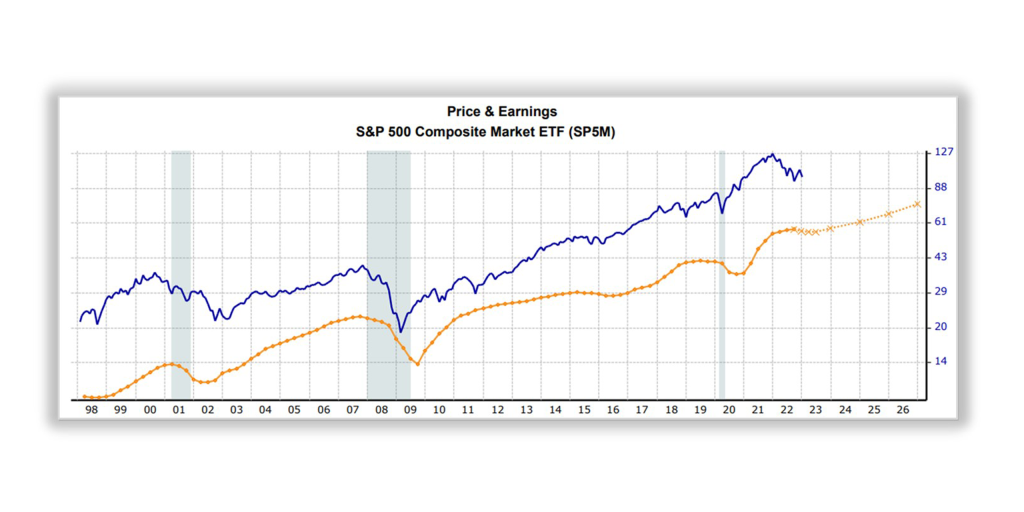
Earnings
Security prices in the long-term are based on underlying company profits.
Competitiveness
Analyze company financials, including corporate profitability, relative to their peers.
Business Cycle
Top-down analysis of economic cycle.
Active Management
Process of analyzing, selecting, and combining securities by Centric’s Investment Committee to generate excess returns.
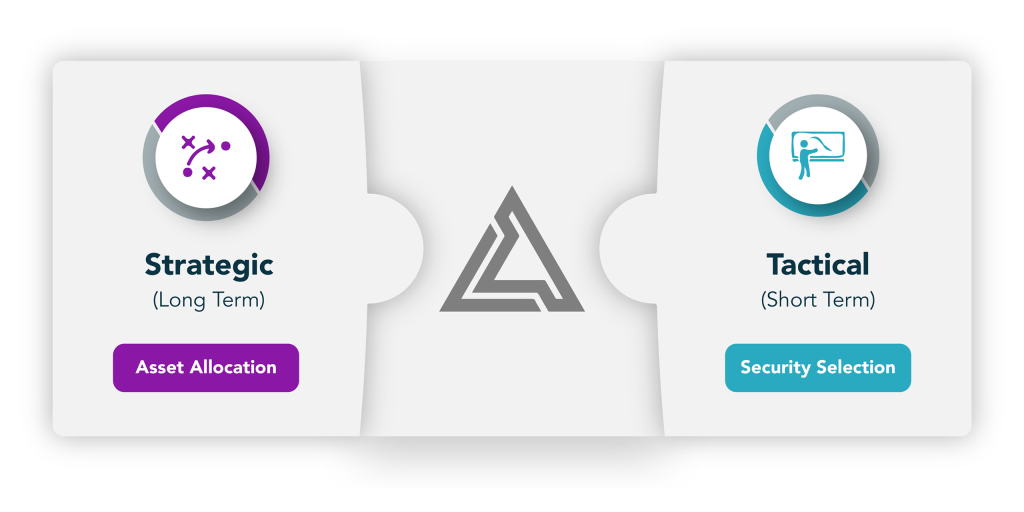
Strategic
Longer-term in nature. Asset allocation is shifted based on investor objectives and risk constraints.
Tactical
Shorter-term in nature. Asset allocation is maintained while individual securities are shifted based on fundamentals (ie: business cycle, corporate profits).
Excess Returns
Tactical in nature to generate Alpha; can be defensive or offensive.
Factors
Underlying characteristics of investment securities; macro and style.
Covered Calls
Securities used to generate additional income while participating in rising markets.
Alts
Securities with low correlation to major stock indexes.
Bull Tilt
Strategic subset of high-beta individual stocks.
True Alpha
Defensive in nature but able to achieve superior risk-adjusted returns over the long-term.
AlphaTilt® Portfolios
Satellite Holdings
Every situation is unique.
Our in-house expertise allows us to build around legacy positions and investment preferences.
Real Estate
A portfolio with allocations to private real estate has historically shown to drive higher returns, with generally more annual income and lower volatility, relative to traditional portfolio of 60% large-cap stocks and 40% bonds.

Important Disclosures
Centric’s Market Assumption Disclosures: This information is not intended as a recommendation to invest in any particular asset class or strategy or product or as a promise of future performance. Note that asset class assumptions are passive, and do not consider the impact of active management. All estimates on this webpage are in US dollar terms unless noted otherwise. Given the complex risk-reward trade-offs involved, we advise clients to rely on their own judgment as well as quantitative optimization approaches in setting strategic allocations to any asset classes and strategies. References to future returns are not promises or even estimates of actual returns a client portfolio may achieve. Assumptions, opinions and estimates are provided for illustrative purposes only. They should not be relied upon as recommendations to buy or sell securities. Forecasts of financial market trends that are based on current market conditions constitute our judgment and are subject to change without notice. We believe the information provided here is reliable, but do not warrant its accuracy or completeness. If the reader chooses to rely on the information, it is at its own risk. This material has been prepared for information purposes only and is not intended to provide, and should not be relied on for, accounting, legal, or tax advice. The outputs of the assumptions are provided for illustration purposes only and are subject to significant limitations. “Expected” return estimates are subject to uncertainty and error. Expected returns for each strategy can be conditional on economic scenarios; in the event a particular scenario comes to pass, actual returns could be significantly higher or lower than forecasted. Because of the inherent limitations of all models/strategies, potential investors should not rely exclusively on the model/strategy when making an investment decision. The model cannot account for the impact that economic, market, and other factors may have on the implementation and ongoing management of an actual investment portfolio. Unlike actual portfolio outcomes, the model/strategy outcomes do not reflect actual trading, liquidity constraints, fees, expenses, taxes and other factors that could impact future returns. Asset allocation/diversification does not guarantee investment returns and does not eliminate the risk of loss.
General Disclosure: This material is intended for information purposes only, and does not constitute investment advice, a recommendation or an offer or solicitation to purchase or sell any securities to any person in any jurisdiction in which an offer, solicitation, purchase or sale would be unlawful under the securities laws of such jurisdiction. Any graphics used are for illustrative purposes only. No graphics displayed are intended to be comprehensive, all inclusive, nor 100% accurate. At any time and at its sole discretion, Centric may add, alter, or remove any graphics displayed on this webpage. Reliance upon information on this webpage is at the sole discretion of the reader. Investing involves risks.
1: Potential Annual Return (PAR) is not the likely return over the next 1 year, but a potential average annual return over a full market cycle. PAR is taken directly from Riskalyze and takes into account return and volatility metrics, dividend payouts, and internal expenses charged by mutual funds and ETFs. PAR assumes that the risk profile of the portfolio will not change throughout market cycles in future years. AlphaTilt® portfolio’s PARs are ESTIMATES taken from Riskalyze for the portfolio at the midpoint of the risk range during the normal phase of an economic cycle.
2: 6 Month 95% Probability Range is calculated from the standard deviation of the portfolio, and represents a hypothetical statistical probability, but there is no guarantee any investments would perform in this range. There is a 5% probability of greater loss.
PAR, 6 Month 95% Probability Range, and Risk Numbers are current as of April 19, 2022. Returns, numbers, and ranges have been rounded for visual display purposes.
3: Riskalyze Disclosure: The Risk Number® is a proprietary scaled index developed by Riskalyze to reflect risk for both advisors and their clients. The Risk Number is at the heart of a sophisticated set of tools to precisely measure the appetite and capacity for risk that each client has, and demonstrate their alignment with the portfolios built for them.
Shaped like a speed limit sign, the Risk Number gives advisors and investors a common language to use when setting expectations, recognizing risk and making portfolio selections. Just like driving faster increases hazards, a higher Risk Number equates with higher levels of risk. Risk Numbers for a given portfolio/model/strategy can change at any time, without notice. An important driver of the Risk Number is the measurement of downside risk: either the downside risk in the investor’s comfort zone (the range of risk to reward that they approve via the Risk Questionnaire or Risk Target), or the downside risk in a portfolio as measured by the 6 Month 95% Probability Range. Centric typically considers Risk Numbers to be in alignment when they are within 5-10 points of each other. For example, a portfolio with a Risk Number of 45 is often used for clients ranging from 40-50.