by Richard Cull
2024 Market Recap and Commentary

“It’s like deja-vu, all over again.”
Yogi Berra
The Year on Main Street
This is a very brief recap of the major events as seen from a Portfolio Manager’s point of view. I began setting this apart from the rest of the recap because sometimes the markets and everyday life move in unrelated or even opposite directions.
The year saw a continuation of 2022/2023 events including Russia’s war with Ukraine, Israel’s war with multiple factions in the Middle East, and continued climate challenges (more record temperatures & devastating storms).
Perhaps most remarkable, 2024 was the year of “Elections” as more than 4 billion people in over 60 countries went to the polls. Summarized by the Pew Research Center, “It also turned out to be a difficult year for incumbents and traditional political parties. Rattled by rising prices, divided over cultural issues and angry at the political status quo, voters in many countries sent a message of frustration.”
On the U.S. economic front, consumer budgets continued to be stretched by higher mortgage rates, higher credit card rates, and higher inflation which is proving “sticky” but thankfully far below 2022 levels.
These challenges are much tougher on lower-income households and were a contributing factor to the political experts incorrect forecast of the November U.S. elections. Despite that frustration, the economy remained strong with increased consumer spending and historically solid employment. The economic experts forecast of a recession (made in late 2022) has still not materialized.
It seems Mark Twain’s observation, “it is difficult to make predictions, particularly about the future” applies to everyone, even experts.
The Year on Wall Street
2022 was one of the worst years in the financial markets as everything turned in meaningfully negative returns, even bonds.
2023 was the opposite of 2022 with almost everything turning in meaningfully positive returns.
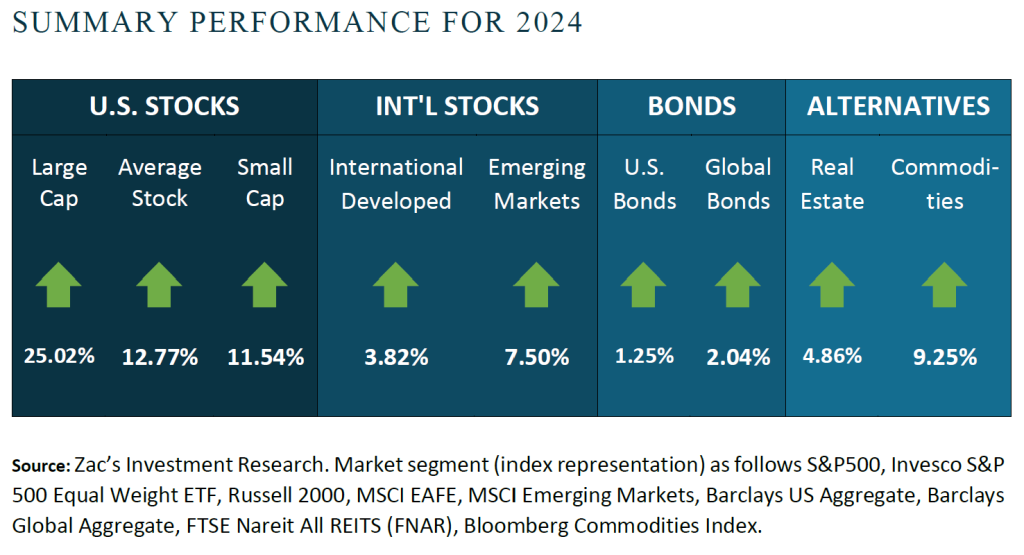
2024 was similar to 2023 with almost everything turning in positive returns; solid but not quite as strong, however.
Bonds were the weakest asset class as both interest rates and the Fed paused mid-year.
Stocks enjoyed an unusual year of lower volatility and a high batting average (S&P 500 was positive 9 of 12 months…9/12= .750 avg.) There were only two months of large declines, April & December, both predicated on the market’s belief that inflation will take longer to reach the Fed’s 2% goal.
Another 2023 theme that carried over was the outsized effect by a small group of tech stocks on the widely followed S&P 500 Index. Because that index is market-cap weighted, this “Magnificent Seven” is a mere 1.5% of the stocks (7 ÷ 500), but makes up over 30% of the indexes weight ($16 trillion ÷ $50 trillion). This means the performance of this tiny group is a major driver of the index return, ergo, as these stocks go, so goes the index.
This needs to be pointed out as the last two years’ exceptionally strong returns were driven by the Magnificent Seven. The “average” stock in the S&P 500 has returned about half of the index return in 2023 & 2024.
The Year Ahead
Three-peat?
Past: Resilient consumer spending buoyed the economy in the face of elevated inflation and higher interest rates. Almost all asset classes finished strong as corporate earnings grew and the Fed began cutting rates.
Current: In addition to an easing Fed, the positives include historically low unemployment, an expanding economy, healthy consumer spending, lower rates of inflation, and forecasted corporate earnings growth. The negatives include the continued war in Ukraine, tense situation in the Middle East, and above-average valuation for stocks. The wildcards are actions that may be taken by the new administration (tariffs, mass deportations, tax cuts, etc).
Future: The widely anticipated recession did not materialize in 2023 or 2024. Despite the elevated level of interest rate and stubborn inflation, consumer confidence and spending rose.
The backdrop for the year ahead is “Cautiously Optimistic”, my term. Current valuations are elevated for stocks in general meaning the market is very optimistic about 2024.
The cautious part comes from a combination of the Fed and the new Federal administration. December’s large drawdown revealed the market’s concern with 1) the Fed holding rates higher for longer and 2) the possibility of tariffs (inflationary). Hopefully both will prove to be non-issues and the markets can turn in positive returns for a third year in-a-row!
Our Approach
Our task is to grow our clients’ assets by investing in tradeable financial assets. To that end, we believe investing is a discipline built on a process developed through extensive education, analysis, and experience.
At Centric, we build diversified portfolios tailored to our individual clients. Our discipline is to focus on the LONG-TERM and ignore the noise, identify QUALITY and be mindful of fads, and understand the FUNDAMENTALS and not simply follow the herd.
Risk Numbers
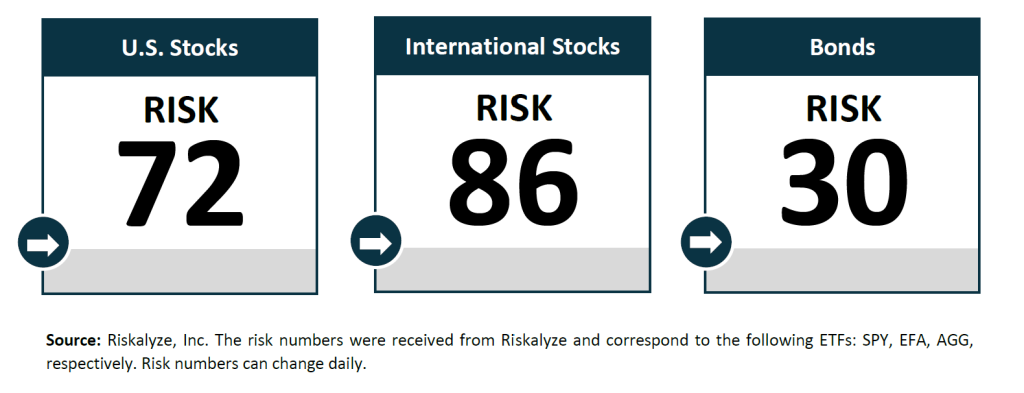
as of 01/13/2025
The Risk Number is at the heart of a sophisticated set of tools to precisely measure the appetite and capacity for risk that each client has and demonstrate their alignment with the portfolios built for them. The following graphic shows the risk of various asset classes as measured on a scale of 1-99 (1 being the most conservative and 99 being the most aggressive) as of the date above.

Centric's Approach
We start with a Risk Number, a measurable way to pinpoint how much risk you want, need, and already have. Then, your wealth advisor will optimally allocate our investments to help you reach your financial goals. Along the way, you will receive transparency of information, seamless proactive service and the trust and accountability you need to stay on track. All of this will lead to your personal comprehensive investment strategy that is powerful, disciplined, responsive.
Sources:
Centric’s Market Assumption Disclosures: This information is not intended as a recommendation to invest in any particular asset class or strategy or product or as a promise of future performance. Note that these asset class assumptions are passive, and do not consider the impact of active management. All estimates in this document are in US dollar terms unless noted otherwise. Given the complex risk-reward trade-offs involved, we advise clients to rely on their own judgment as well as quantitative optimization approaches in setting strategic allocations to all the asset classes and strategies. References to future returns are not promises or even estimates of actual returns a client portfolio may achieve. Assumptions, opinions and estimates are provided for illustrative purposes only. They should not be relied upon as recommendations to buy or sell securities. Forecasts of financial market trends that are based on current market conditions constitute our judgment and are subject to change without notice. We believe the information provided here is reliable, but do not warrant its accuracy or completeness. If the reader chooses to rely on the information, it is at its own risk. This material has been prepared for information purposes only and is not intended to provide, and should not be relied on for, accounting, legal, or tax advice. The outputs of the assumptions are provided for illustration purposes only and are subject to significant limitations. “Expected” return estimates are subject to uncertainty and error. Expected returns for each asset class can be conditional on economic scenarios; in the event a particular scenario comes to pass, actual returns could be significantly higher or lower than forecasted. Because of the inherent limitations of all models, potential investors should not rely exclusively on the model when making an investment decision. The model cannot account for the impact that economic, market, and other factors may have on the implementation and ongoing management of an actual investment portfolio. Unlike actual portfolio outcomes, the model outcomes do not reflect actual trading, liquidity constraints, fees, expenses, taxes and other factors that could impact future returns. Asset allocation/diversification does not guarantee investment returns and does not eliminate the risk of loss.
Index Disclosures: Index returns are for illustrative purposes only and do not represent any actual fund performance. Index performance returns do not reflect any management fees, transaction costs or expenses. Indices are unmanaged and one cannot invest directly in an index.
Riskalyze Disclosure: The Risk Number® is a proprietary scaled index developed by Riskalyze to reflect risk for both advisors and their clients. The Risk Number is at the heart of a sophisticated set of tools to precisely measure the appetite and capacity for risk that each client has, and demonstrate their alignment with the portfolios built for them.
Shaped like a speed limit sign, the Risk Number gives advisors and investors a common language to use when setting expectations, recognizing risk and making portfolio selections. Just like driving faster increases hazards, a higher Risk Number equates with higher levels of risk.
General disclosure: This material is intended for information purposes only, and does not constitute investment advice, a recommendation or an offer or solicitation to purchase or sell any securities to any person in any jurisdiction in which an offer, solicitation, purchase or sale would be unlawful under the securities laws of such jurisdiction. Reliance upon information in this material is at the sole discretion of the reader. Investing involves risks.
Get in Touch
Ready to take control of your finances and enjoy more of what matters in your life?