by Richard Cull
April Market Recap
Commentary
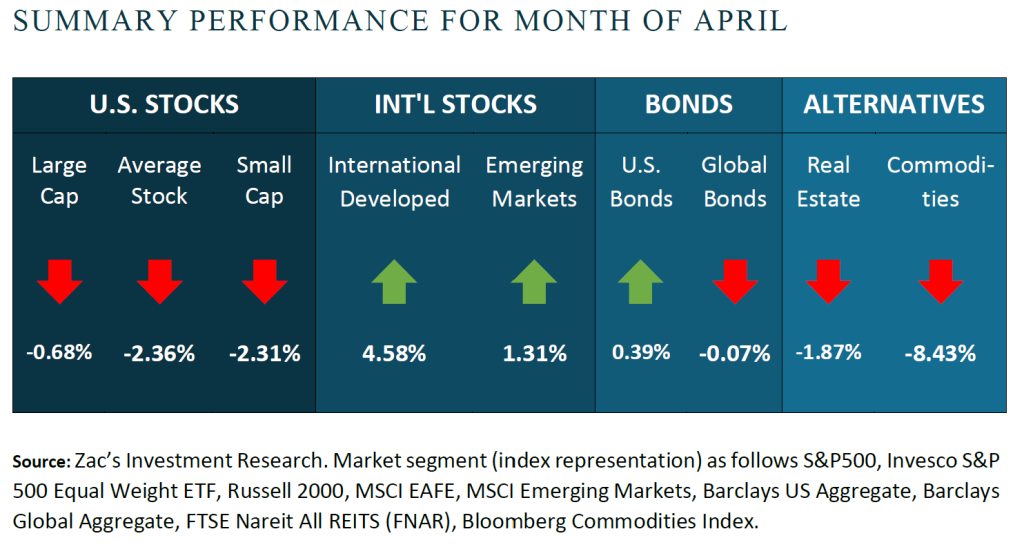
I wrote in my previous blog that March felt like several months, well April felt like an entire year. After a strong January, equity markets, as represented by the S&P 500 index, have now declined 3 consecutive months. Down over 11% the first six trading days of April, stocks thankfully recovered and nearly finished flat. Bonds, which are supposed to provide stability in turbulent markets, did just that, finishing the fourth consecutive month with positive returns.
As I penned in my special April 3rd Pull Back blog, the driving force behind the financial markets continues to be tariffs and the resulting uncertainty. The combination of these two forces pushed the markets dangerously close to bear market territory early in the month.
With the risk of getting too granular I need to point out a couple of specific dates.
April 7th was indicative of the height of the tariff volatility & uncertainty. The S&P 500 index was down over 4% in the first hour of trading, then an erroneous headline circulated suggesting President Trump was considering a 90 day delay for tariffs, aside from China. The markets immediately shot up 8%. As the headline was debunked, the markets fell and settled down 2% for the day. It marked one of the largest intraday reversals in decades.
April 9th was a huge up day. With bond prices and the US Dollar falling, concern of investors abandoning US assets lead President Trump to dial back tariffs on trading partners to 10% for 90 days. The S&P 500 gained 9.5%, its largest percentage gain since October 2008.
There were two other extraordinary volatile days during the month around April 20th as the president talked about firing fed chairman Powell (markets down big)…or maybe not (markets up big).
And so went the markets for the most volatile month in five years. Large discrepancies between intraday highs and lows were a regular feature. Specifically, the S&P averaged a spread between daily highs and lows of 3.13% while the tech-heavy NASDAQ averaged a spread of 3.59%. It’s hard for me to relay just how insane these numbers are…you’ll have to take my word on it.
We expect volatility to remain elevated in the months ahead. Instead of attempting to predict short-term market moves or reacting to every headline, we stay grounded in our investment discipline. Our process remains focused on long-term fundamentals, supported by the Centric investment committee, which is now meeting more frequently to assess potential impacts of evolving policies and determine any necessary strategic or tactical adjustments.
Risk Numbers
as of 05/05/2025
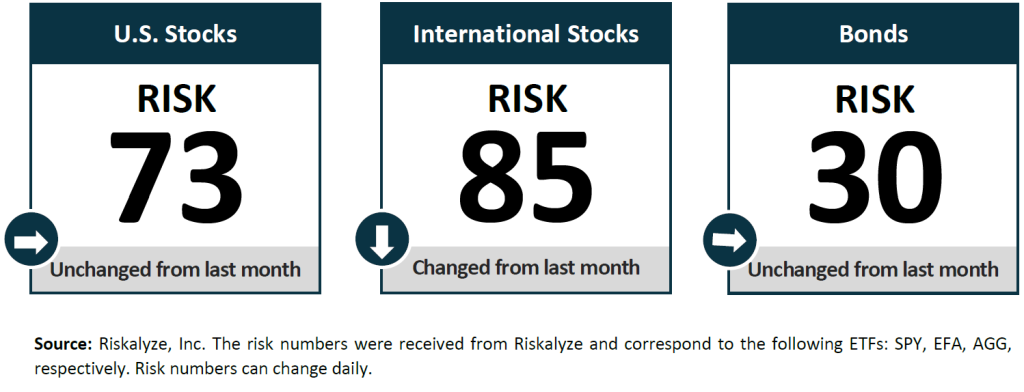
The Risk Number is at the heart of a sophisticated set of tools to precisely measure the appetite and capacity for risk that each client has and demonstrate their alignment with the portfolios built for them. The following graphic shows the risk of various asset classes as measured on a scale of 1-99 (1 being the most conservative and 99 being the most aggressive) as of the date above.
Centric's Approach
We start with a Risk Number, a measurable way to pinpoint how much risk you want, need, and already have. Then, your wealth advisor will optimally allocate our investments to help you reach your financial goals. Along the way, you will receive transparency of information, seamless proactive service and the trust and accountability you need to stay on track. All of this will lead to your personal comprehensive investment strategy that is powerful, disciplined, responsive.
Sources
Centric’s Market Assumption Disclosures: This information is not intended as a recommendation to invest in any particular asset class or strategy or product or as a promise of future performance. Note that these asset class assumptions are passive, and do not consider the impact of active management. All estimates in this document are in US dollar terms unless noted otherwise. Given the complex risk-reward trade-offs involved, we advise clients to rely on their own judgment as well as quantitative optimization approaches in setting strategic allocations to all the asset classes and strategies. References to future returns are not promises or even estimates of actual returns a client portfolio may achieve. Assumptions, opinions and estimates are provided for illustrative purposes only. They should not be relied upon as recommendations to buy or sell securities. Forecasts of financial market trends that are based on current market conditions constitute our judgment and are subject to change without notice. We believe the information provided here is reliable, but do not warrant its accuracy or completeness. If the reader chooses to rely on the information, it is at its own risk. This material has been prepared for information purposes only and is not intended to provide, and should not be relied on for, accounting, legal, or tax advice. The outputs of the assumptions are provided for illustration purposes only and are subject to significant limitations. “Expected” return estimates are subject to uncertainty and error. Expected returns for each asset class can be conditional on economic scenarios; in the event a particular scenario comes to pass, actual returns could be significantly higher or lower than forecasted. Because of the inherent limitations of all models, potential investors should not rely exclusively on the model when making an investment decision. The model cannot account for the impact that economic, market, and other factors may have on the implementation and ongoing management of an actual investment portfolio. Unlike actual portfolio outcomes, the model outcomes do not reflect actual trading, liquidity constraints, fees, expenses, taxes and other factors that could impact future returns. Asset allocation/diversification does not guarantee investment returns and does not eliminate the risk of loss.
Index Disclosures: Index returns are for illustrative purposes only and do not represent any actual fund performance. Index performance returns do not reflect any management fees, transaction costs or expenses. Indices are unmanaged and one cannot invest directly in an index.
Riskalyze Disclosure: The Risk Number® is a proprietary scaled index developed by Riskalyze to reflect risk for both advisors and their clients. The Risk Number is at the heart of a sophisticated set of tools to precisely measure the appetite and capacity for risk that each client has, and demonstrate their alignment with the portfolios built for them.
Shaped like a speed limit sign, the Risk Number gives advisors and investors a common language to use when setting expectations, recognizing risk and making portfolio selections. Just like driving faster increases hazards, a higher Risk Number equates with higher levels of risk.
General disclosure: This material is intended for information purposes only, and does not constitute investment advice, a recommendation or an offer or solicitation to purchase or sell any securities to any person in any jurisdiction in which an offer, solicitation, purchase or sale would be unlawful under the securities laws of such jurisdiction. Reliance upon information in this material is at the sole discretion of the reader. Investing involves risks.
Get in Touch
Ready to take control of your finances and enjoy more of what matters in your life?