by Richard Cull
August Market Recap & Commentary
Commentary
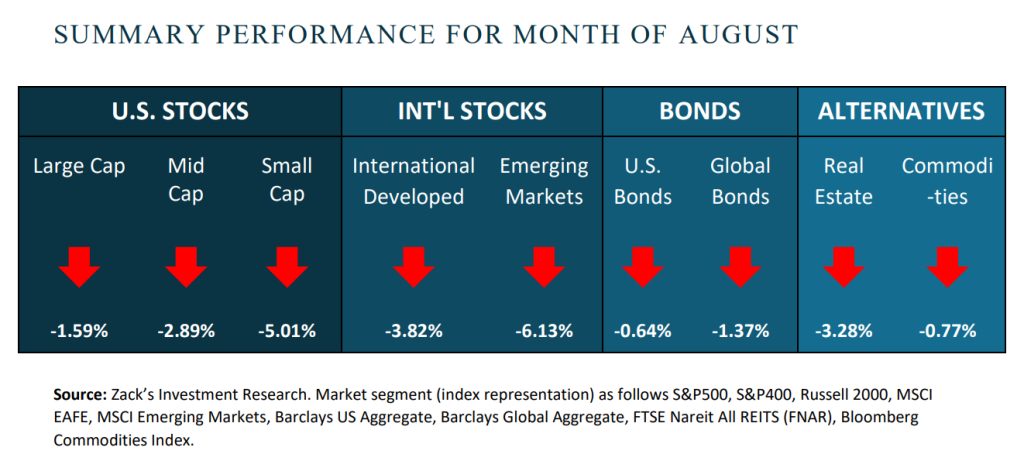
August was another quiet period for investments but unlike the previous six months, returns were negative. As we wrote last month, the trend of 2023 has been quietly higher, with large technology stocks leading the way.
During the month investors continued to focus on two primary economic drivers…the Federal Reserve and corporate earnings.
The Federal Reserve did not meet during the month after raising the Fed Funds rate by a quarter of one percent in late July. Fed Chairman Jerome Powell did speak at the Jackson Hole Symposium and reiterated recent remarks that the Fed will be measured with future rate hikes while being diligent in working to bring inflation back down to their 2% target. While seemingly innoxious, this sentiment sent short and intermediate term bonds lower (raising their rates) as investors realized the Fed may keep rates higher for longer.
Corporate earnings for the second quarter were down year-over-year but slightly better than feared. This marks the third consecutive quarter of falling earnings and the sixth consecutive quarter of declining net margins. Results were mixed as some sectors (Consumer Discretionary, Consumer Staples) grew earnings in the aggregate while others (Energy, Basic Materials) reported meaningfully lower results.
Interesting to note that even within the sectors, results were mixed. Case in point Retail…Walmart & Target. In the post-COVID period, Target continues to struggle while Walmart shows all-around strength. Target has failed to foresee shifts in consumer spending away from discretionary categories like apparel, home furnishings, and electronics resulting in unsold inventory and necessary markdowns. Walmart stumbled in the first quarter but recovered quickly with the help of its much larger grocery business.
A non-economic theme capturing attention of late is A.I. (Artificial Intelligence). Since the launch of ChatGPT late last year, companies have been looking at ways that computer learning and problem solving can increase efficiency and profitability. Investors are more than eager to buy stocks in those companies they believe will harness the next generation of computing. Graphics chips processor Nvidia has become the poster child as they are currently the only ones delivering semiconductors powerful enough to meet A.I.’s demand for increased chip power. Further, actual demand for their chips has driven their earnings up near 100% and their stock price up 237% so far in 2023.
As we move past Labor Day, it will be very interesting to see how these economic and thematic events play out and the markets’ reaction to them. There continues to be uncertainty around the Fed, guarded optimism around corporate earnings and unbridled euphoria around A.I…time will tell.
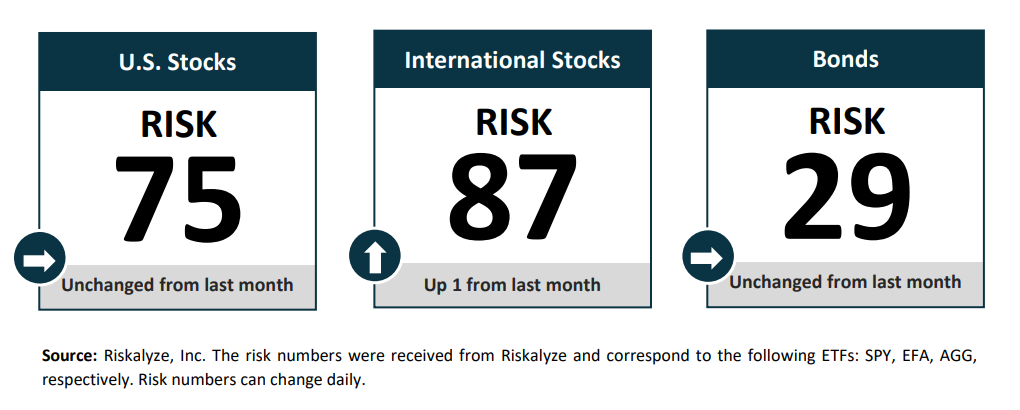
Risk Numbers
The Risk Number is at the heart of a sophisticated set of tools to precisely measure the appetite and capacity for risk that each client has, and demonstrate their alignment with the portfolios built for them. The following graphic shows the risk of various asset classes as measured on a scale of 1-99 (1 being the most conservative and 99 being the most aggressive) as of the date above.
CENTRIC’S Approach
We start with a Risk Number, a measurable way to pinpoint how much risk you want, need, and already have. Then, your wealth advisor will optimally allocate our investments to help you reach your financial goals. Along the way, you will receive transparency of information, seamless proactive service and the trust and accountability you need to stay on track. All of this will lead to your personal comprehensive investment strategy that is powerful, disciplined, responsive.
Sources:
Centric’s Market Assumption Disclosures: This information is not intended as a recommendation to invest in any particular asset class or strategy or product or as a promise of future performance. Note that these asset class assumptions are passive, and do not consider the impact of active management. All estimates in this document are in US dollar terms unless noted otherwise. Given the complex risk-reward trade-offs involved, we advise clients to rely on their own judgment as well as quantitative optimization approaches in setting strategic allocations to all the asset classes and strategies. References to future returns are not promises or even estimates of actual returns a client portfolio may achieve. Assumptions, opinions and estimates are provided for illustrative purposes only. They should not be relied upon as recommendations to buy or sell securities. Forecasts of financial market trends that are based on current market conditions constitute our judgment and are subject to change without notice. We believe the information provided here is reliable, but do not warrant its accuracy or completeness. If the reader chooses to rely on the information, it is at its own risk. This material has been prepared for information purposes only and is not intended to provide, and should not be relied on for, accounting, legal, or tax advice. The outputs of the assumptions are provided for illustration purposes only and are subject to significant limitations. “Expected” return estimates are subject to uncertainty and error. Expected returns for each asset class can be conditional on economic scenarios; in the event a particular scenario comes to pass, actual returns could be significantly higher or lower than forecasted. Because of the inherent limitations of all models, potential investors should not rely exclusively on the model when making an investment decision. The model cannot account for the impact that economic, market, and other factors may have on the implementation and ongoing management of an actual investment portfolio. Unlike actual portfolio outcomes, the model outcomes do not reflect actual trading, liquidity constraints, fees, expenses, taxes and other factors that could impact future returns. Asset allocation/diversification does not guarantee investment returns and does not eliminate the risk of loss.
Index Disclosures: Index returns are for illustrative purposes only and do not represent any actual fund performance. Index performance returns do not reflect any management fees, transaction costs or expenses. Indices are unmanaged and one cannot invest directly in an index.
Riskalyze Disclosure: The Risk Number® is a proprietary scaled index developed by Riskalyze to reflect risk for both advisors and their clients. The Risk Number is at the heart of a sophisticated set of tools to precisely measure the appetite and capacity for risk that each client has, and demonstrate their alignment with the portfolios built for them.
Shaped like a speed limit sign, the Risk Number gives advisors and investors a common language to use when setting expectations, recognizing risk and making portfolio selections. Just like driving faster increases hazards, a higher Risk Number equates with higher levels of risk.
General disclosure: This material is intended for information purposes only, and does not constitute investment advice, a recommendation or an offer or solicitation to purchase or sell any securities to any person in any jurisdiction in which an offer, solicitation, purchase or sale would be unlawful under the securities laws of such jurisdiction. Reliance upon information in this material is at the sole discretion of the reader. Investing involves risks.
Get in Touch
Ready to take control of your finances and enjoy more of what matters in your life?