by Richard Cull
October Market Recap & Commentary
Commentary
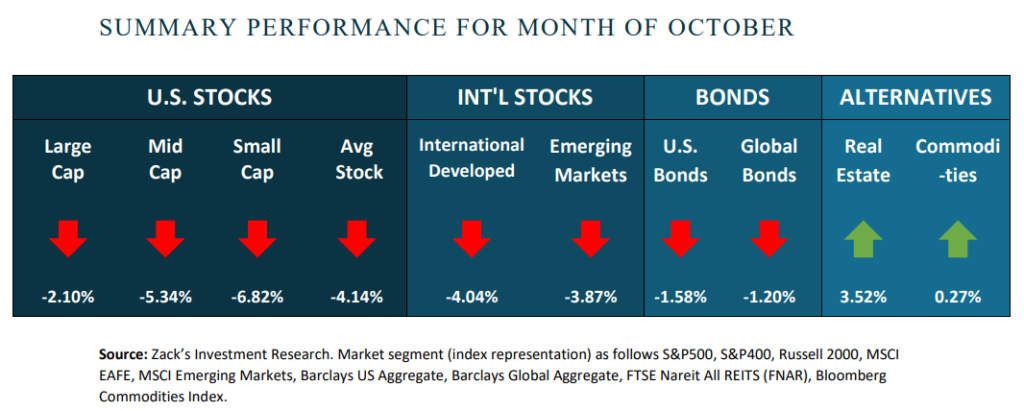
October looked very similar to September unfortunately as almost all asset class returns were negative. Over the last three months, both the NASDAQ and the S&P 500 have fallen over 10% from their July highs which qualifies as a “market correction.” While these occur once a year on average, it’s still unsettling to experience.
News and events were plentiful during the month headlined by the surprise attack on Israel by Hamas. In addition to the tragic humanitarian costs of that attack and resulting conflict, markets began to point out similarities with our current economy and the 1970’s. Former Treasury Secretary Larry Summers fanned the flames by postulating the current path of inflation could track that of the late 70’s. As a refresher, inflation had almost returned to normal levels in 1976 but then a crisis in the Middle East sparked another painful round of rising prices. High inflation coupled with weak economic growth led to stagflation, an economic phase especially tough to move through. There are differences between now and then with the biggest being the world’s reduced dependence on middle east oil.
Here in the U.S., the bottom line continues to be the resilience of the consumer against a multitude of factors weighing on our economy. As perfectly summarized by JPMorgan chief global strategist David Kelly, “Despite a low saving rate, slow demographics, depressed confidence, a crippled housing market, rising interest costs and growing credit problems, … American consumers increased their inflation-adjusted spending by more than 4% in the third quarter.” That spending led to the highest GDP since the pandemic and corporations reporting higher than expected earnings for Q3.
Speaking of earnings, it appears that the string of year-over-year earnings declines will end at three quarters. While only half of the S&P 500 member companies have reported, revenues and earnings are surprisingly above levels of Q3 2022. These positive announcements, however, are not enough to power stocks higher as many companies are tempering or outright warning about future earnings.
Heading into the last two months of the year, the Federal Reserve kicked things off by announcing another “Pause” (leaving interest rates unchanged) but reiterating their commitment to tame inflation.
We believe the next few months will see an increase in market volatility as this economic news is digested and the potentially escalating middle eastern conflict is monitored.
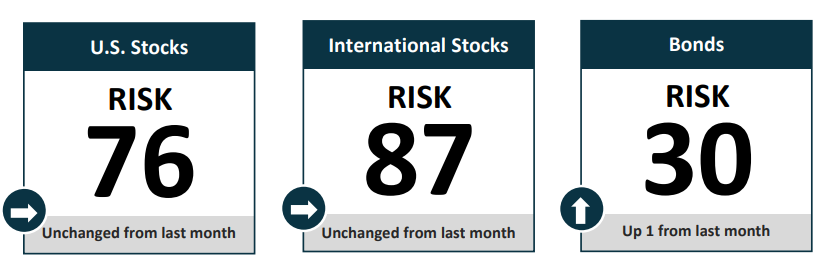
Risk Numbers
The Risk Number is at the heart of a sophisticated set of tools to precisely measure the appetite and capacity for risk that each client has, and demonstrate their alignment with the portfolios built for them. The following graphic shows the risk of various asset classes as measured on a scale of 1-99 (1 being the most conservative and 99 being the most aggressive) as of the date above.
CENTRIC’S Approach
We start with a Risk Number, a measurable way to pinpoint how much risk you want, need, and already have. Then, your wealth advisor will optimally allocate our investments to help you reach your financial goals. Along the way, you will receive transparency of information, seamless proactive service and the trust and accountability you need to stay on track. All of this will lead to your personal comprehensive investment strategy that is powerful, disciplined, responsive.
Sources:
Centric’s Market Assumption Disclosures: This information is not intended as a recommendation to invest in any particular asset class or strategy or product or as a promise of future performance. Note that these asset class assumptions are passive, and do not consider the impact of active management. All estimates in this document are in US dollar terms unless noted otherwise. Given the complex risk-reward trade-offs involved, we advise clients to rely on their own judgment as well as quantitative optimization approaches in setting strategic allocations to all the asset classes and strategies. References to future returns are not promises or even estimates of actual returns a client portfolio may achieve. Assumptions, opinions and estimates are provided for illustrative purposes only. They should not be relied upon as recommendations to buy or sell securities. Forecasts of financial market trends that are based on current market conditions constitute our judgment and are subject to change without notice. We believe the information provided here is reliable, but do not warrant its accuracy or completeness. If the reader chooses to rely on the information, it is at its own risk. This material has been prepared for information purposes only and is not intended to provide, and should not be relied on for, accounting, legal, or tax advice. The outputs of the assumptions are provided for illustration purposes only and are subject to significant limitations. “Expected” return estimates are subject to uncertainty and error. Expected returns for each asset class can be conditional on economic scenarios; in the event a particular scenario comes to pass, actual returns could be significantly higher or lower than forecasted. Because of the inherent limitations of all models, potential investors should not rely exclusively on the model when making an investment decision. The model cannot account for the impact that economic, market, and other factors may have on the implementation and ongoing management of an actual investment portfolio. Unlike actual portfolio outcomes, the model outcomes do not reflect actual trading, liquidity constraints, fees, expenses, taxes and other factors that could impact future returns. Asset allocation/diversification does not guarantee investment returns and does not eliminate the risk of loss.
Index Disclosures: Index returns are for illustrative purposes only and do not represent any actual fund performance. Index performance returns do not reflect any management fees, transaction costs or expenses. Indices are unmanaged and one cannot invest directly in an index.
Riskalyze Disclosure: The Risk Number® is a proprietary scaled index developed by Riskalyze to reflect risk for both advisors and their clients. The Risk Number is at the heart of a sophisticated set of tools to precisely measure the appetite and capacity for risk that each client has, and demonstrate their alignment with the portfolios built for them.
Shaped like a speed limit sign, the Risk Number gives advisors and investors a common language to use when setting expectations, recognizing risk and making portfolio selections. Just like driving faster increases hazards, a higher Risk Number equates with higher levels of risk.
General disclosure: This material is intended for information purposes only, and does not constitute investment advice, a recommendation or an offer or solicitation to purchase or sell any securities to any person in any jurisdiction in which an offer, solicitation, purchase or sale would be unlawful under the securities laws of such jurisdiction. Reliance upon information in this material is at the sole discretion of the reader. Investing involves risks.
Get in Touch
Ready to take control of your finances and enjoy more of what matters in your life?