by Richard Cull
September 2022 Market Recap & Commentary
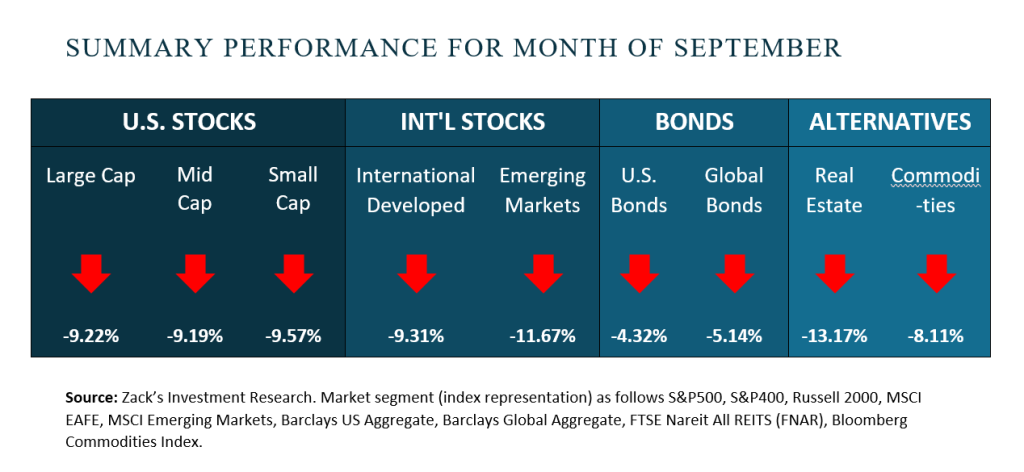
The month of September saw negative numbers across almost all asset classes for the second consecutive month. Two of the three major stocks indexes, the NASDAQ and S&P 500 have posted three consecutive negative quarters for the first time since the 2008 crisis. Unfortunately, bonds, which normally offer a haven for investors during bear markets, are experiencing one of their worst years on record.
Behind the negative numbers are three major themes…1) persistent inflation, 2) a hawkish Federal Reserve and 3) a potential recession.
This has become a cycle as 1) inflation leads to 2) a tightening Fed which fuels the fears of 3) a potential recession.
Each piece of price data is scrutinized by the markets in hopes that inflation will soon subside. Economic releases during the month however, ran contrary to that hope. That in turn led the Fed to raise rates another three-quarters of a percent and signal they are prepared to raise rates markedly higher over a longer period of time. Economist, business leaders and even former Fed governors are going on the record opining the inevitable result will be a recession.
But what does that really mean? GDP, the official measure of our domestic economy was negative for both the first and second quarters…by definition a “recession.” Yet it did not feel like a contraction as unemployment hovered near historic lows, consumers increased spending and corporations reported higher earnings. Perhaps history will label that a “Statistical Recession” but today’s markets are focused on the future rather than the past.
Investing in 2022 is like a meteorologist studying a developing storm in the south Pacific trying to assess potential land fall and severity. While it is a science, the number of dynamic variables (water temperature, environmental wind field, beta drift, etc) render most forecasts inaccurate (sometimes mildly, sometimes wildly). For investing the observable variables on the short-term horizon are general price levels, employment levels and corporate profitability.
Behind those is the single most important, dynamic, and unknowable variable…the consumer. How the consumer feels (expectations) and most importantly how the consumer acts (spending vs. saving) will determine when / if a recession makes land fall and the extent of that possible contraction.
At Centric we side with Warren Buffet’s belief that trading around near-term expectations / emotions is folly. Investing to grow wealth is a long-term endeavor based on corporate profitability. We are students of history while remaining aware of the prevailing winds. It is during market environments such as these that our experience, discipline, and conviction are front of mind and prove most valuable to our clients.
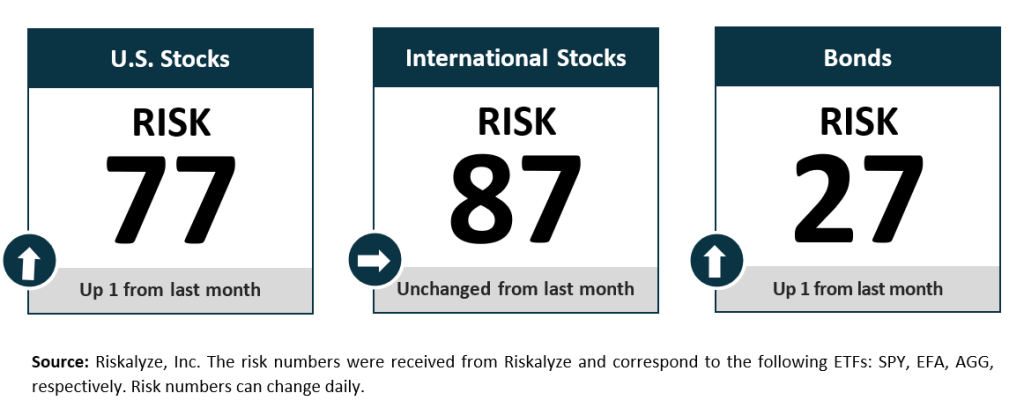
Risk Numbers
The Risk Number is at the heart of a sophisticated set of tools to precisely measure the appetite and capacity for risk that each client has, and demonstrate their alignment with the portfolios built for them. The following graphic shows the risk of various asset classes as measured on a scale of 1-99 (1 being the most conservative and 99 being the most aggressive) as of the date above.
Centric's Approach
We start with a Risk Number, a measurable way to pinpoint how much risk you want, need, and already have. Then, your wealth advisor will optimally allocate our investments to help you reach your financial goals. Along the way, you will receive transparency of information, seamless proactive service and the trust and accountability you need to stay on track. All of this will lead to your personal comprehensive investment strategy that is powerful, disciplined, responsive.
Sources:
Centric’s Market Assumption Disclosures: This information is not intended as a recommendation to invest in any particular asset class or strategy or product or as a promise of future performance. Note that these asset class assumptions are passive, and do not consider the impact of active management. All estimates in this document are in US dollar terms unless noted otherwise. Given the complex risk-reward trade-offs involved, we advise clients to rely on their own judgment as well as quantitative optimization approaches in setting strategic allocations to all the asset classes and strategies. References to future returns are not promises or even estimates of actual returns a client portfolio may achieve. Assumptions, opinions and estimates are provided for illustrative purposes only. They should not be relied upon as recommendations to buy or sell securities. Forecasts of financial market trends that are based on current market conditions constitute our judgment and are subject to change without notice. We believe the information provided here is reliable, but do not warrant its accuracy or completeness. If the reader chooses to rely on the information, it is at its own risk. This material has been prepared for information purposes only and is not intended to provide, and should not be relied on for, accounting, legal, or tax advice. The outputs of the assumptions are provided for illustration purposes only and are subject to significant limitations. “Expected” return estimates are subject to uncertainty and error. Expected returns for each asset class can be conditional on economic scenarios; in the event a particular scenario comes to pass, actual returns could be significantly higher or lower than forecasted. Because of the inherent limitations of all models, potential investors should not rely exclusively on the model when making an investment decision. The model cannot account for the impact that economic, market, and other factors may have on the implementation and ongoing management of an actual investment portfolio. Unlike actual portfolio outcomes, the model outcomes do not reflect actual trading, liquidity constraints, fees, expenses, taxes and other factors that could impact future returns. Asset allocation/diversification does not guarantee investment returns and does not eliminate the risk of loss.
Index Disclosures: Index returns are for illustrative purposes only and do not represent any actual fund performance. Index performance returns do not reflect any management fees, transaction costs or expenses. Indices are unmanaged and one cannot invest directly in an index.
Riskalyze Disclosure: The Risk Number® is a proprietary scaled index developed by Riskalyze to reflect risk for both advisors and their clients. The Risk Number is at the heart of a sophisticated set of tools to precisely measure the appetite and capacity for risk that each client has, and demonstrate their alignment with the portfolios built for them.
Shaped like a speed limit sign, the Risk Number gives advisors and investors a common language to use when setting expectations, recognizing risk and making portfolio selections. Just like driving faster increases hazards, a higher Risk Number equates with higher levels of risk.
General disclosure: This material is intended for information purposes only, and does not constitute investment advice, a recommendation or an offer or solicitation to purchase or sell any securities to any person in any jurisdiction in which an offer, solicitation, purchase or sale would be unlawful under the securities laws of such jurisdiction. Reliance upon information in this material is at the sole discretion of the reader. Investing involves risks.
Get in Touch
Ready to take control of your finances and enjoy more of what matters in your life?